 下载格隆汇APP
 下载诊股宝App
 下载汇路演APP
 社区
社区
 会员
会员
来源:思想也是市场
通过分析大量来自中国行政管理部门的数据,我们研究发现,在2014-2015年大牛市与股灾期间,中国家庭所持风险资产的财富不平等现象显著加剧:在这一时期的活跃交易中,股票市场顶端0.5%的家庭获得了收益,而底层85%的家庭损失惨重,高达2500亿人民币。
相比之下,如果在熊市,资产的差异很难造成如此显著的回报差异。本文中,我们将提出一系列可能性来解释这种现象,并探究如此局面背后的深意。
阿尔弗雷多(Alvaredo)等学者研究证实,过去的50年间,全球财富不平等现象激增。最引人注目的一点,则是极端高收入人群的财富份额正在飙升,即便他们只占总人口前0.01%。
这种财富集中度看似是由于收入分配愈发不公,背后却有另一个重要的驱动因素:金融投资的收益严重不均。正如皮凯蒂的畅销书(《21世纪资本论》,2014)所强调的,第二种差异是激化财富分配不公的重要诱因——“有钱人比别人获得更高的平均回报是完全有可能的。”
2014-2015:中国股市泡沫破裂
通过本次研究,我们将观察在中国市场中,股票投资如何让社会财富变得越来越集中。泡沫与泡沫崩溃的阶段值得关注的原因有三点:
首先,泡沫崩盘时期总是伴随着异常高的交易量和收益率波动,市场大规模洗牌,财富重新分配。
其次,与平静时期相比,泡沫起落的阶段往往输赢无定。比如,著名的艾萨克·牛顿,人类历史上最伟大的物理学家和精明的投资者,就一时头脑发热,把全部身家砸进南海泡沫里,赔了个精光。
第三,也是最重要的原因,虽然泡沫经济在发达国家中已不常见,在发展中国家却仍然异常普遍。
2011年,马尔门迪尔和纳格尔的研究发现,早期的生活经历对个体具有重大意义,甚至能跨越几十年来主导我们的经济决策(Malmendier and Nagel, 2011)。2019年,巴塔林泽(Badarinza) 指出,在发展中国家,反复出现的极端价格波动,哪怕只是短期现象,也会对数亿国民的日常行为和经济水平产生长远影响。
于是,我们以2014年7月至2015年12月的中国泡沫破灭事件作为背景。当时,股市起落的激烈程度和过山车不相上下:上证指数从2014年7月初攀升至次年6月12日的峰值,涨幅150%,到当年12月,又暴跌40%。为了将这种极端情况产生的财富再分配与市场条件平静时期作对比,我们也对2014年6月之前两年半的数据进行了同样的分析。
不同类型的投资者
我们从上海证券交易所获得了约4000万账户的详细持有量和交易记录。广义而言,这些帐户主要分为三类:家庭(散户),机构,和企业账户——企业账户也包括其他公司的交叉持股和政府资助实体的所有权。在研究开始时,我们又将第一类散户根据深沪交易所的持股总和,加上账户中的现金持有量,细分为四个类别:低于50万人民币(WG1),50万到300万之间(WG2),300万到1000万(WG3),1000万以上(WG4)。
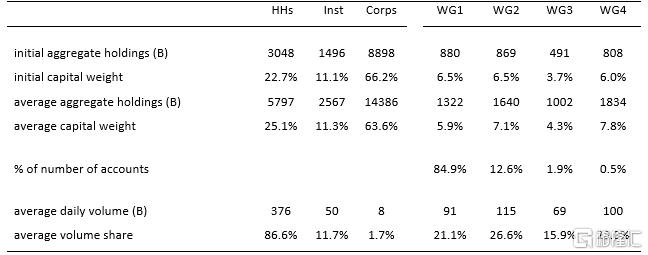
表格1列出了各个投资群体的账户价值和交易量(单位:10亿人民币)。总体而言,企业账户虽然持有市场价值的64%,但只贡献了总交易额的2%;机构账户占总市值的11%、交易量的12%;散户只占总市值的25%,却占交易量的近90%。
在这些个人投资者中,四个群体的资本权重和数量份额相对平衡。然而,就账户数量而言,拥有最微薄财富的群体是所有家庭账户的85%,而顶层的0.5%富人们则支配着巨额资产。
资本流动导致的财富迁移
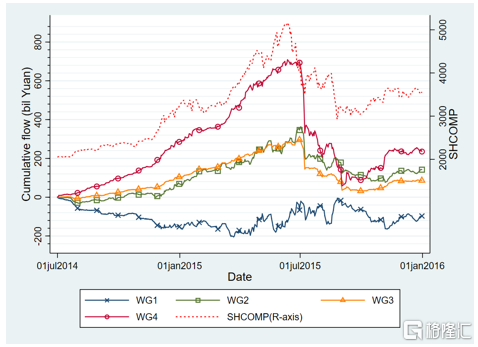
我们将重点研究散户群体的投资情况,该领域占总交易量的近90%。如图1所示,在繁荣时期,收入最高的0.5%的家庭进入了股票市场,而收入最低的85%的家庭减少了他们的股票持有量。高峰期过后不久,富人迅速退出市场,将部分股票出售给较小的个体散户,另一部分则出售给企业。
泡沫崩溃时期的个人投资累积流动交易额
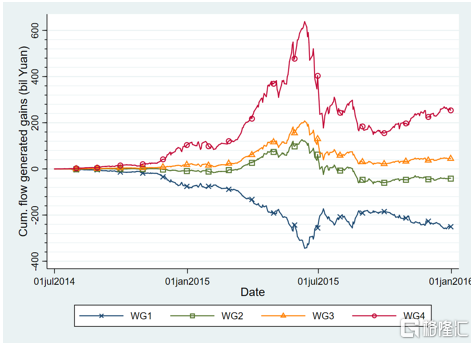
接下来,我们为不同的财富组计算流量及交易产生的收益和损失,如图2,以相同初始持有量的买入持有投资者作为基准。从2014年7月到2015年12月,收入最低的85%的投资者损失超过2500亿人民币,而在这18个月期间,收入最高的0.5%的家庭却获得高达2540亿回报。
假设投资于股市的每一元人民币都追踪市场指数,我们就可以忽略复杂的投资组合。这时,财富再分配中,约有千亿归因于资金流入和流出市场,剩余的1500亿人民币的财富流动就可以是归为异类投资组合的结果。
这些数字告诉我们,与2014年6月的初始股权财富相比,在18个月之内,流动产生的累积收益,使得最底层的人群损失了28%的资金,最富裕的群体却获得了31%的收益。
累积流动交易产生的投资收益
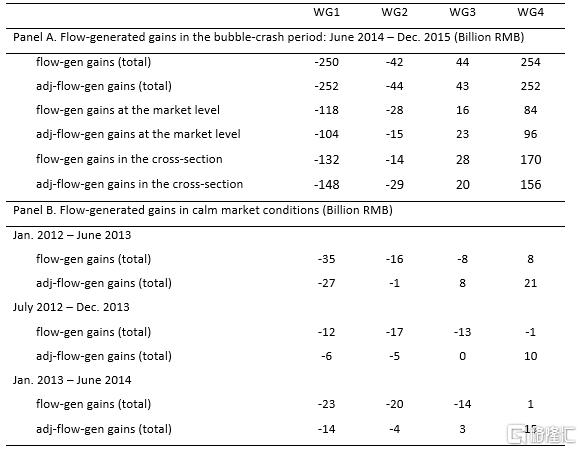
与之形成鲜明对比的是,在平静的市场条件下,财富的重新分配比泡沫破裂时期的财富分配要小一个数量级。如表格2所示,在2014年6月之前的两年半中的任何18个月内,超富裕人士(在股票财富分配中排名前0.5%的人士)的收益最高为210亿元人民币,这意味着他们的财富仅仅增加了3%(与泡沫破裂时期的30%相比)。与之对应,最底层的家庭群体损失了类似的数量。

波动与平静市场条件下的流量产生收益
为何?
对于这些发现,我们考虑了许多可能的解释。其中,最显而易见的也许是净值不同的投资者具有不同的规划平衡需求。事实上,一个简单的投资组合选择模型,只要考虑到股票市场的不同组合,就可以产生部分我们研究中出现的流动模式。
但是,这种再平衡所驱动的交易(更广泛地说,是任何与实现的市场收益成线性关系的反馈交易策略)仅占观察到的各群体财富转移的一小部分,甚至不到10%。
与此相反,我们认为家庭投资技能的差异主导了样本中的财富再分配现象。研究发现,在整体市场千亿级别的财富再分配中,近一半是由于小投资者的择时能力不佳。与泡沫破灭之初的投资者相比,选择在泡沫破灭时期进入市场的人群往往缺乏经验,也因此遭受翻倍的损失。
在市场层面上,新入市者仅占投资资本的18%,却构成了财富被转移的30%。这只是一个剖面,却不难看出,最底层的85%的家庭所做的交易使他们的股票收益严重萎缩,而最顶层的0.5%的家庭却总能做出正确判断。
综上所述,虽然小微投资者和超级富有人群选股能力在股市平静时期就存在一定差异,但在泡沫崩溃事件中,时机波动和交易量飙升,这种区别呈数倍放大,导致前者资产不断蒸发,而财富则被大量集中到超级富有的人群手中。
进一步推断
以上结论指出,资金量最大的0.5%的投资者在泡沫破裂事件中大发横财,而最底层的85%却代价惨痛。这样的结果一定程度上暴露出了政策导向的问题。通常,人们很容易认为只要更多参与股市或者其他风险金融市场,就能变得更富裕、更平等,特别是在金融知识和市场参与度普遍较低的发展中国家。但实际情况恰好与之相反。
事实证明,在充满泡沫和崩溃的金融市场中,如果贫困、财务紧张的群体盲目投资甚至梭哈,反而会导致本就微薄的资产再次缩水。
还有一点需要重视,上文提到,早期不稳定和不宽裕的生活经历对数十年后的个人经济决策拥有长期影响。因此,尤其是在发展中国家,政治家和学者有义务向人们强调,虽然对穷人来说积极参与股票市场能让他们有机会改善生活水平,但是缺乏经验的盲目投资更容易带来完全相反的结果。

Wealth Redistribution in the Chinese Stock Market: the Role of Bubbles and Crashes
by Li An, Jiangze Bian, Dong Lou, Donghui Shi
July 1, 2020
Using comprehensive administrative data from China, we document a substantial increase in inequality of wealth held in risky assets by Chinese households in the 2014–2015 bubble-crash episode: the top 0.5% households in the equity market gained, while the bottom 85% lost, 250B RMB through active trading in this period, equating to 30% of each group’s initial equity wealth. In comparison, the return differential between the top and bottom groups in periods of a relatively calm stock market is an order of magnitude smaller. We examine a number of possible explanations for these findings and discuss their implications.
The past half century has witnessed a worldwide surge in wealth inequality (e.g., Alvaredo et al. 2013; Alvaredo et al. 2018). The most alarming aspect of this finding is a sharp increase in the wealth share of the ultra-wealthy (e.g., the top 0.01% of the wealth distribution). This rise in wealth concentration could be in part due to an increase in income disparity, but it may also be driven by heterogenous returns from financial investments. In his best-selling book, Piketty (2014) emphasizes this last factor in driving wealth inequality when he writes, “[I]t is perfectly possible that wealthier people obtain higher average returns than less wealthy people.” Bach et al. (2019), Campbell et al. (2019), and Fagereng et al. (2019) provide consistent evidence in the context of Northern European and Indian markets.
The 2014–2015 Bubble-Crash in the Chinese Stock Market
In our recent study, we examine the impact of stock market investment on the concentration of household wealth held in equities in the Chinese setting. Particularly, we emphasize the role of bubbles and crashes in driving wealth inequality; we focus on these extreme episodes for three main reasons. First, bubble-crash episodes are almost always accompanied by extraordinary levels of trading volume and return volatilities, which can give rise to wealth redistribution on an enormous scale. Second, relative to calm periods, it is less clear who wins and who loses in bubbles and crashes. For example, Sir Isaac Newton, one of the greatest scientists in human history and a savvy investor, lost his lifetime savings through massive bets in the South Sea bubble.
The third and perhaps most important reason is that while bubble-crash episodes occur infrequently in developed countries, they are much more common in developing economies. Given the recent finding that salient, early-life experiences affect individuals’ economic decisions decades later (e.g., Malmendier and Nagel, 2011), these repeated occurrences of extreme price movements, albeit short-lived, can have long-lasting impacts on the behavior and welfare of hundreds of millions of households in these countries (e.g., Badarinza et al. 2019).
Our main setting is the bubble-crash episode in China from July 2014 to December 2015, when the Chinese stock market experienced a roller-coaster ride: the Shanghai Composite Index climbed more than 150% from the beginning of July 2014 to its peak on June 12, 2015, before crashing 40% by the end of December 2015. To contrast wealth redistribution in this extreme episode with that in calm market conditions, we repeat our analyses using the two-and-half years prior to June 2014, when the market was relatively calm.
Different Investor Groups in the Market
We obtain administrative data from the Shanghai Stock Exchange, which include detailed holdings and trading records of the entire investor population of around 40M accounts. At the broadest level, we classify all accounts into three categories: those owned by households, institutions, and corporations. The last category includes both cross-holdings by other firms and ownership by government-sponsored entities. Household accounts are further stratified into four groups based on account value (the sum of equity holdings in both the Shanghai and the Shenzhen stock exchanges plus cash in the account) at the beginning of our sample with the following cutoffs: below 500k RMB (WG1), 500k to 3 million RMB (WG2), 3 million to 10 million RMB (WG3), and above 10 million RMB (WG4).
Table 1 shows the account value and trading volume (in billion RMB) of various investor groups. On average, corporations hold 64% of the market value but contribute less than 2% of the trading volume. Institutions are responsible for 11% of the market value and 12% of the trading volume. Finally, households account for 25% of the market value but nearly 90% of the trading volume. Within the household sector, capital weight and volume share are relatively balanced across the four groups. In terms of the number of accounts, however, the bottom wealth group includes 85% of all household accounts while the top wealth group includes 0.5% of all household accounts.
Table 1. Account Value and Trading Volume by Investor Groups

Capital Flows and the Resulting Wealth Effect
We focus our analysis squarely on the household sector, which constitutes nearly 90% of total trading. As shown in Figure 1, in the boom period, the top 0.5% households moved into the stock market while the bottom 85% reduced their stock market exposure. Shortly after the peak, the wealthy quickly exited the market, selling their shares partly to smaller households and partly to corporations.
Figure 1. Cumulative Flows of Households in the Bubble-Crash Period

We then calculate flow- (trading-) generated gains and losses for different wealth groups (Figure 2). In other words, our benchmark is a buy-and-hold investor with the same initial holdings. The bottom 85% of households lose 250B RMB from July 2014 to December 2015, while the top 0.5% gain 254B RMB in this 18-month period. Around 100B of this wealth redistribution can be attributed to capital flows into and out of the market (i.e., assuming that every RMB invested in the stock market tracks the market index, thus ignoring any heterogeneity in portfolio composition). The remaining 150B RMB redistribution is the result of heterogeneous portfolio holdings. To put these figures in perspective, the cumulative flow-generated gains in this 18-month period amount to a 28% loss for the bottom wealth group and a 31% gain for the top wealth group, compared with their initial equity wealth in June 2014.
Figure 2. Cumulative Flow-Generated Gains of Households

In stark contrast, wealth redistribution in calm market conditions is an order of magnitude smaller than that in the bubble-crash episode. As shown in Table 2, for any 18-month subperiod in the two-and-half years prior to June 2014, the ultra-wealthy (those in the top 0.5% of the equity wealth distribution) enjoy a gain of up to 21B RMB, which translates to a percentage gain of 3% of their initial equity wealth (compared to the 30% gain in the bubble-crash period). We observe losses of similar magnitudes by the bottom household group in this two-and-half-year period.
Table 2. Flow-Generated Gains in Volatile vs. Calm Market Conditions
Potential Explanations
We consider a number of possible explanations for our findings. Perhaps the most natural explanation is that investors with different levels of financial wealth have different rebalancing needs. Indeed, a simple portfolio-choice model that allows for heterogeneous exposures to the stock market can generate part of the flow patterns in our study. However, such rebalancing-motivated trades—and more generally, any feedback trading strategy that is a linear function of realized market returns—can only account for a small fraction (less than 10%) of the observed wealth transfer across household groups.
We instead argue that the wealth redistribution in our sample is at least in part due to differences in households’ investment skills. We show that nearly half of the 100B RMB redistribution at the market level is due to small investors’ poor market-timing. Compared with accounts that exist at the beginning of the bubble, new entrants to the market during the bubble period (who are usually less experienced) suffer disproportionate losses; new entrants account for 30% of the wealth transfer at the market level, but only 18% of the invested capital. In the cross-p of stocks, we find that trading by the bottom 85% households significantly and negatively forecasts future stock returns, while that by the top 0.5% positively predicts stock returns.
The key takeaway from our study is that the heterogeneity in market timing and stock selection ability between the poor and the ultra-wealthy, while also present in calm periods, is greatly amplified in bubble-crash episodes, when both volatilities and trading volume spike.
Further Implications
Our finding that the largest 0.5% households make a windfall in a bubble-crash episode at the expense of the bottom 85% has implications for policymakers. It is often believed that greater stock market participation (or participation in any other risky financial market) is a path to prosperity and equality, especially in developing countries where financial literacy and market participation are generally low. However, if the poor, less financially sophisticated invest actively in financial markets that are prone to bubbles and crashes, such participation can be detrimental to their wealth.
This is particularly concerning given the recent finding that salient early life experiences have long-lasting impacts on individuals’ economic decisions decades later. Consequently, policymakers and academics must emphasize that while greater stock market participation can be welfare-improving—especially for the poor—active investment by the poor will likely result in the exact opposite.
(Li An, Tsinghua PBC School of Finance; Jiangze Bian, University of International Business and Economics; Dong Lou, London School of Economics and CEPR; Donghui Shi, Shanghai Stock Exchange and Fanhai International School of Finance, Fudan University)