 下载格隆汇APP
 下载诊股宝App
 下载汇路演APP
 社区
社区
 会员
会员
作者:市川新田三丁目
 Oil prices and the exchange rate of the U.S. dollar against the euro
have often moved together over the past decade or so, but it is not at
all clear why they should. The standard interpretation of oil price
movements as a response to global oil supply and demand shifts makes it
unlikely that the correlation stems from the dollar’s effect on oil
prices. In addition, the notorious difficulty in predicting currency
moves makes it hard to believe that oil prices dictate the dollar’s
value. Improbability aside, however, in this blog post we document the
tendency for the value of the dollar to rise relative to European
currencies when oil prices fall, and we consider a possible explanation
for the correlation.
Oil prices and the exchange rate of the U.S. dollar against the euro
have often moved together over the past decade or so, but it is not at
all clear why they should. The standard interpretation of oil price
movements as a response to global oil supply and demand shifts makes it
unlikely that the correlation stems from the dollar’s effect on oil
prices. In addition, the notorious difficulty in predicting currency
moves makes it hard to believe that oil prices dictate the dollar’s
value. Improbability aside, however, in this blog post we document the
tendency for the value of the dollar to rise relative to European
currencies when oil prices fall, and we consider a possible explanation
for the correlation.
在过去十年左右的时间里,国际市场原油价格与美元/欧元的汇率经常出现涨跌方向存在关联的现象,但原因和机理完全不为人所知。一个常见的解读是油价随着全球石油供求关系的变化而波动,但这个说法无法解释由美元汇率对油价的影响而导出的关联关系。此外,外汇汇率素来以难以预测而“闻名遐迩”,因此很难让人相信油价会支配美元汇率的走势。但还是先把不可能说清楚的东西放在一遍吧,我们在文中会阐述油价下跌时美元/欧元汇率的升值趋势以及我们认为有可能解读这一关联关系的理由是什么。
A Recent Correlation
关联关系出现的时间并不长 The pattern of the dollar weakening when oil prices move higher starts
around 2005. The chart below considers oil prices and the dollar
exchange rate against the euro at a quarterly frequency. (The chart uses
dollars per unit of foreign currency as the exchange rate measure, so
an increase represents a weaker dollar.) The correlation was
particularly noticeable in the 2006-10 and 2014-18 periods. Not shown
are the data for the 1980s and 1990s, since no correlation is evident
during these periods of oil price stability.在油价走高之时美元汇率会贬值的情况始于2005年前后。下图显示的是国际市场原油价格与欧元美元的关联关系,数据频率为季度,图中美元/欧元的汇率是以一个单位的欧元等于多少美元来表示,因此数值越大说明美元汇率贬值程度越高,蓝线为布伦特油价走势,红线为美元/欧元的汇率。关联关系表现最明显的时期是在2006-2010年期间以及2014-2018年期间,图中没有涵盖1980年代和1990年代的数据,因为在此期间油价处于平稳状态,油价与美元/欧元汇率之间的关联关系不明显。 The next chart converts the data into percentage changes, with the
plotted line representing a simple regression result. The estimated
coefficient suggests that a 10 percent increase in oil prices is
associated with a 1.5 percent depreciation of the dollar against the
euro. Over the 2005-18 period, oil price movements can explain 33
percent of the quarterly moves in the dollar–euro exchange rate as
measured by the R-squared statistic. Note that the correlation is much
weaker if the regression is done using monthly data, with the R-squared
falling to 14 percent, and it becomes negligible for weekly and daily
changes. One explanation for the dependence of the result on the
frequency of observations is that using averages over a longer time
horizon filters out nonpersistent, “noisy” currency and oil price
movements.
下面这张图是将上图中的数值转换成百分比数据,散点直线图标示的是简单线性回归的结果。回归系数的计算结果显示油价每上涨10%,美元/欧元汇率就会贬值1.5%。根据R^2的计算结果,2005-2018年期间油价的波动可以解释美元/欧元汇率季度变动幅度中33%的部分。值得注意的是,如果用月度报价来做线性分析的话,这种关联关系很弱,R平方值的计算结果会掉到14%。如果用每周或每日的报价来计算,结果将更加微不足道。对于计算结果对于数据频率的依赖性有一个解释是,数据均值的取值期限越长,就越能过滤掉持续性不强,带有“市场噪音”特点的外汇和油价波动情况。
The next chart converts the data into percentage changes, with the
plotted line representing a simple regression result. The estimated
coefficient suggests that a 10 percent increase in oil prices is
associated with a 1.5 percent depreciation of the dollar against the
euro. Over the 2005-18 period, oil price movements can explain 33
percent of the quarterly moves in the dollar–euro exchange rate as
measured by the R-squared statistic. Note that the correlation is much
weaker if the regression is done using monthly data, with the R-squared
falling to 14 percent, and it becomes negligible for weekly and daily
changes. One explanation for the dependence of the result on the
frequency of observations is that using averages over a longer time
horizon filters out nonpersistent, “noisy” currency and oil price
movements.
下面这张图是将上图中的数值转换成百分比数据,散点直线图标示的是简单线性回归的结果。回归系数的计算结果显示油价每上涨10%,美元/欧元汇率就会贬值1.5%。根据R^2的计算结果,2005-2018年期间油价的波动可以解释美元/欧元汇率季度变动幅度中33%的部分。值得注意的是,如果用月度报价来做线性分析的话,这种关联关系很弱,R平方值的计算结果会掉到14%。如果用每周或每日的报价来计算,结果将更加微不足道。对于计算结果对于数据频率的依赖性有一个解释是,数据均值的取值期限越长,就越能过滤掉持续性不强,带有“市场噪音”特点的外汇和油价波动情况。
何为R平方值?
R平方值,即决定系数或判定系数,也称为拟合优度,是相关系数的平方,表示可根据自变量的变异来解释因变量的变异部分。
如某学生在某智力量表上所得的IQ分与其成绩的相关系数r=0.66,则决定系数R^2=0.66*0.66=0.4356,即该生的成绩约有44%可由该智力量表所测的智力部分来解释。
决定系数的大小决定了相关的密切程度。R^2越接近1,表示相关的方程式参考价值越高;相反,越接近0,表示参考价值越低。
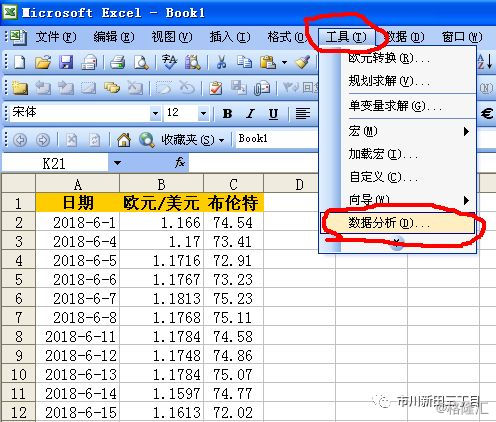
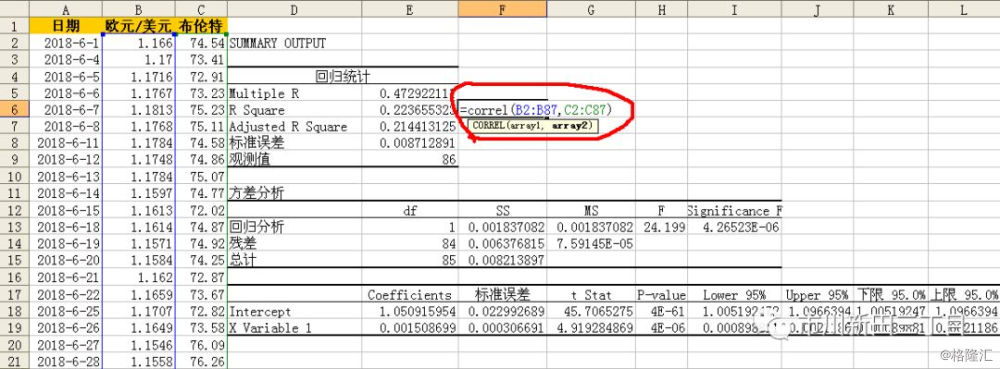
如何用Excel计算R^2值?
以欧元/美元的汇率和布伦特油价为例,取值范围为2018-6-1至2018-9-28:

1、打开Excel“工具栏”的“数据分析”
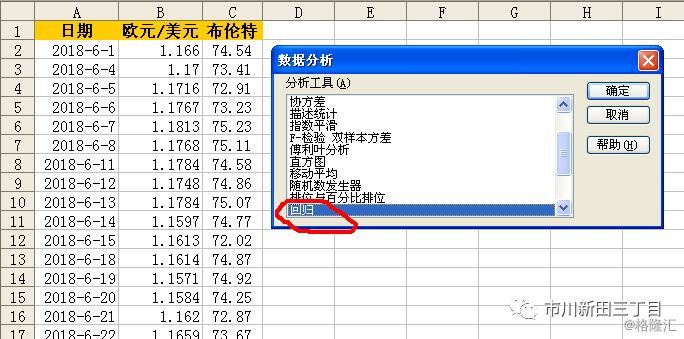
2、选择“数据分析”中的“回归”
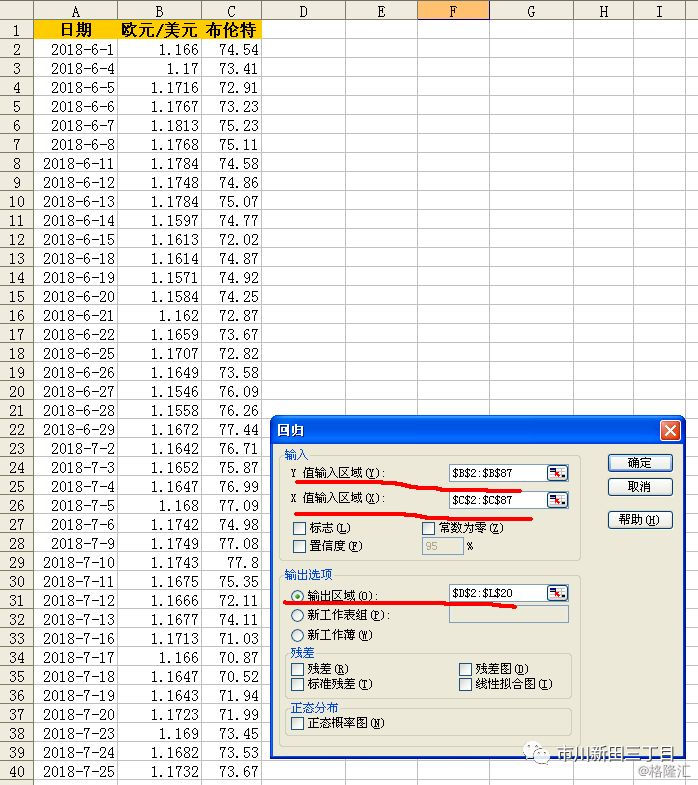
3、选择“回归”功能栏中的Y值区域,取值范围从B2到B87;在X值区域,取值范围从C2到C87,然后点击确定
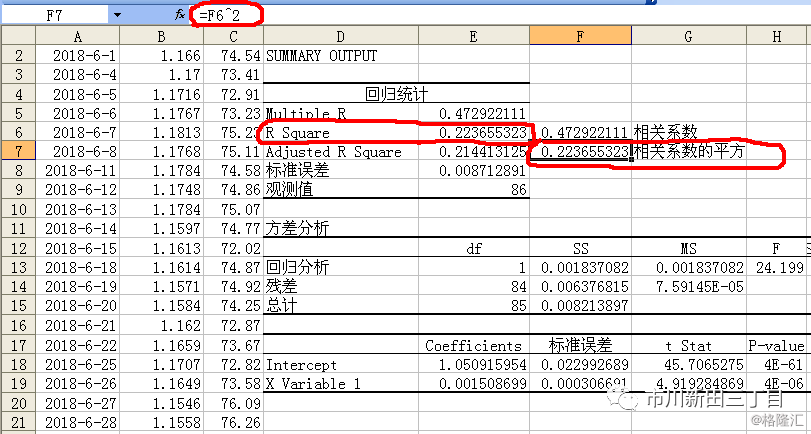
4、输出结果如下,其中R平方值等于0.223655323,说明在2018-6-1至2018-9-28期间,油价的波动可以解释22.365%的欧元/美元汇率波动情况
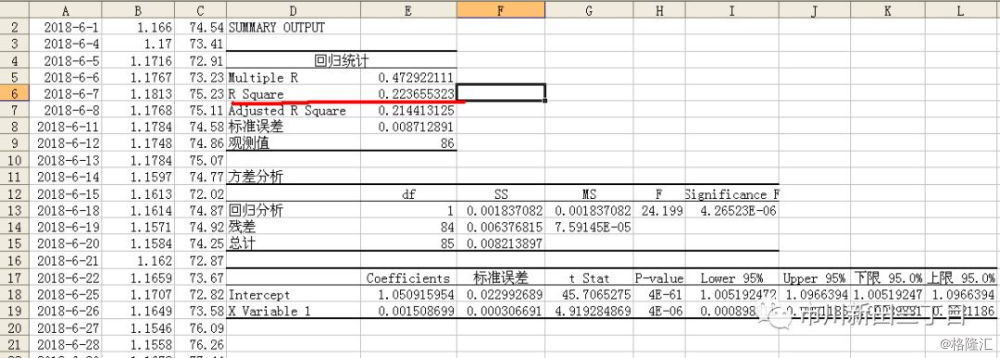
5、根据定义,R的平方值就是相关系数的平方,可以验证一下EXCEL的计算结果是否正确。用correl函数来计算相关系数,结果为0.472922111,然后将0.472922111乘方等于0.223655323,与EXCEL计算的R平方值相等
 The next set of charts shows that the relationship with oil prices is
similarly strong for the exchange rate of the U.S. dollar against the
U.K. pound and only a bit weaker for the dollar–Swiss franc rate. The
yen–dollar rate, however, stands out for displaying no correlation with
oil prices. So, the pattern is evident for the dollar against European
currencies but not against the yen.
The next set of charts shows that the relationship with oil prices is
similarly strong for the exchange rate of the U.S. dollar against the
U.K. pound and only a bit weaker for the dollar–Swiss franc rate. The
yen–dollar rate, however, stands out for displaying no correlation with
oil prices. So, the pattern is evident for the dollar against European
currencies but not against the yen.
下面几张图显示的是油价与美元/英镑的汇率之间也存在类似的强相关关系,油价与美元/瑞士法郎之间的相关关系也有,只是有点弱,但在油价与美元/日元的汇率之间并没有展现出任何相关关系。因此,油价明显与美元/欧洲货币的汇率相关,但与日元的汇率并无关联。 Does the Dollar Drive Oil Prices?
美元汇率会影响油价的走势? Available data make it possible to attribute oil price movements to supply and demand developments. For example, in the first half of 2018, oil prices moved up as increased demand in China and India, coupled with a drop in Venezuela’s production, was enough to cause inventories to fall despite higher production in North America. 现有数据有可能证明油价的波动与供求关系的变化有关。例如在2018年上半年,随着中国和印度的石油需求增加油价出现上涨,与此同时,尽管北美石油产量增加但委内瑞拉的石油产量下降,降幅之大足以导致全球石油库存出现减少。The four large oil price swings since the mid-2000s, all matched by moves in dollar exchange rates against European currencies, can be similarly explained by using supply and demand data. Specifically, the pre-2009 run-up in oil prices was influenced by fast global oil demand growth and declining U.S. oil production. The subsequent drop in prices proceeded from a fall in oil demand during the global financial crisis, and the subsequent rebound in oil prices in 2010 and 2011 was attributable to the recovery in global oil demand, most notably in China, and only a small increase in OPEC production. Finally, the drop in prices in late 2014 followed a jump in Saudi production as authorities decided to staunch the loss of market share from higher North American production.
2000年代中期以来油价发生了四次大的波动,同样也可以用供求方面的数据予以解释,这四次波动发生期间美元/欧洲国家货币的汇率均经历了类似的波动。具体来说,2009年之前的油价大涨是受到全球石油需求迅速增长和美国石油产量大跌的影响,在此之后油价出现大幅下跌,大跌之前全球金融危机期间石油需求出现下降,随后油价在2010和2011年期间出现反弹,原因来自于全球石油需求的恢复性增长,尤其是中国的石油需求在此期间出现增长而石油输出国组织的石油产量只有小幅增长。最后,油价在2014年末出现大跌,而在此之前沙特的石油产量大幅增长,因为沙特增产的目的是为了弥补北美地区石油产量增加给沙特的石油出口份额造成的损失。It’s possible that changes in oil demand, particularly during the global financial crisis, affected other factors that then influenced the dollar exchange rates against European currencies, but it is not clear what factor would play out as differences between the United States and Europe. Why would an increase in Asian oil demand put downward pressure on the dollar against the euro area? Why would an increase in Saudi production cause the dollar to strengthen?
石油需求方面的变化,尤其是全球性金融危机期间石油需求方面的变化,会影响其他因素的变化并进而影响美元/欧洲国家货币的汇率走势,但并不清楚是什么因素在发挥作用导致欧美之间存在差异。为什么亚洲石油需求的增加会造成美元/欧元区货币的汇率出现贬值?为什么沙特石油产量的增加会带来美元汇率的走强?
Searching for an Explanation
寻找可能的答案 Various arguments might be advanced for why oil prices could affect the dollar’s exchange rate with European currencies. One argument is that higher oil prices lower expected U.S. output growth relative to Europe’s, putting downward pressure on the dollar. It is true that Europe tends to tax gasoline much more heavily, so that changes in crude oil prices have a more modest impact on consumers and firms than in the United States. Still, it is hard to make the case that the more modest energy price swings in Europe have that much impact on the relative output/interest rate expectations of the two regions. 有几个说法可能会对油价影响美元/欧洲国家货币汇率的原因作出解释。其中一个说法是,油价走高会造成美国经济相对于欧洲经济的未来经济表现出现降低,因而给美元汇率带来下行压力。欧洲征收的汽油税确实相当高,因此国际市场原油价格的变化对欧洲地区个人和企业的影响程度远比美国要低。但是很难证明,如果欧洲地区能源价格的波幅更温和一些是否会对欧美两地的经济增长和利率水平的预期表现产生很大影响。
The correlation could also arise because oil-exporting countries (say, Saudi Arabia) put a higher share of their cross-border investments into European assets than do oil-importing countries (say, China and Japan), so the transfer of income to oil exporters when oil prices rise reduces the demand for dollars. This may be because Middle East oil producers invoice their exports in dollars but buy more goods and services produced in Europe than in the United States. For this reason, they may be relatively more prone to buy European assets than other major cross-border investors like China.
关于油价和美元/欧洲国家货币汇率之间的关联关系还有一种说法认为,在跨境投资欧洲资产方面,像沙特这样的石油出口国所占的份额要远超中国和日本这样的石油进口国。因此当油价上涨时流向石油出口国的资金增加,降低了对美元的需求。这有可能是因为中东地区的石油出口国出口石油时收的是美元,但是在欧洲地区购入商品和服务所花的钱却比在美花销要多。正是出于这个原因,相对而言,石油出口国比其他主要的跨境投资者,如中国,更倾向于投资欧洲。
The fact that oil-exporters were not major cross-border investors until the 2000s fits the timeline of when the dollar-oil price correlation appeared. IMF data show the North Africa/Middle East region running current account deficits in the 1980s and 1990s, indicating that this region was borrowing rather than investing in the rest of the world. The balance turned into a $77 billion surplus in 2000 in response to a 50 percent increase in oil prices over the previous two years. The upward trend in oil prices eventually pushed the balance to $340 billion in 2008. The rate of foreign investment by oil exporters has since then moved in step with oil prices, falling to $44 billion in 2009, jumping to $414 billion in 2012, and collapsing into net selling territory in 2015. This narrative may also clarify why the correlation is most noticeable during the large oil price swings, since these were also periods when the volume of cross-border purchases of financial assets changed most.
在2000年以前石油出口国还不是主要的跨境投资者,这一情况出现的时点与美元汇率和油价之间展现出强关联关系的时点是契合的。国际货币基金组织的数据显示,在1980和1990年代,北非和中东国家的经常项目账户处于赤字状态,说明这一地区在此时期是借钱的一方而不是在全球其他地区投资的一方。2000年随着油价在之前的两年里上涨50%,该区域国家的经常项目账户实现了770亿美元的顺差,油价的持续上涨使该区域国家经常项目账户的顺差到了2008年达到了3400亿美元。石油出口国对外投资的力度随着油价的上涨节节升高,对外投资额在2009年跌至440亿美元,2012年跳升至4140亿美元,到了2015年则猛降到净卖出的水平。这一说法也能解释清楚为什么油价和美元汇率之间的关联关系在油价出现大幅波动期间会变得更加明显,因为油价大幅波动期间也是跨境投资金融资产的金额波动最大的时期。
Conclusion and Caveat
结论和附加说明 The observed correlation between oil prices and the dollar is difficult to explain. The argument underlying this blog post is that it is unlikely that changes in the dollar drive changes in oil prices. So, why would changes in oil prices cause changes in exchange rates? Or is it that there are other variables that systematically influence both, creating the observed correlation? We have considered a number of possible narratives, suggesting some paths for future research. Of course, the caveat is that the correlation has not been around for very long, so one should be cautious in reading too much into it. The longer this correlation persists, however, the more it will deserve a convincing explanation.
很难解释清楚油价和美元汇率之间明显存在的关联关系。本文隐含的一个观点是美元汇率的变动不太可能导致油价的波动。因此,为什么油价的波动会影响美元汇率的走势?是不是有其他的变量在系统性地影响这两者的走势,因而导致了关联关系的出现?我们在文中涉及到了几种可能的解释原因,为未来的研究找出了一些方向。当然,需要补充一点,这种该关联关系出现的时间并不长,因此不应该对其做过多的解读。但是,这种关联关系出现的时间越长,就越应该获得更有说服力的解释。
摘要:
2005年至今,在油价走高之时美元兑欧元和英镑等欧洲国家货币的汇率会贬值
石油出口国投资欧洲的意愿比其他主要的跨境投资者要高
中东地区的石油出口国出口石油收取的美元最主要的投资去向是欧洲而不是美国
2000年代以来随着石油价格的上涨,中东地区的石油出口国实现了贸易顺差,并大量投资欧洲地区
中东地区的石油出口国对外投资的金额与油价走势正相关